Infographics are basically a graphical representation of data. In other words, a fun graph. These graphics present complex information quickly and clearly, such as in signs, maps, journalism, technical writing, and education. Each of these options are really useful, but none have the ability to give you a super-easy method to quickly understand what is going on like a well designed and eye-pleasing infographic.
Here are 25 places you can go on the web to see some great visual graphics to help inspire you to make your own. These graphics are excellent visual tools for explaining huge amounts of information where complex data needs to be explained immediately and clearly. Plus, if you have found any other infographics that you want to share with TutorialChip users, feel free to let us know by dropping in a comment.
You may be interested in the following posts:
- Reliable Brochure Design Ideas
- Annual Report Design Inspiration
- Appreciated Package Design Examples
- Eye Popping Examples of Flyer Designs
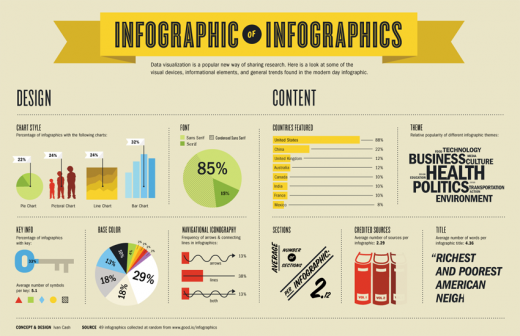
1. Ivan Cash
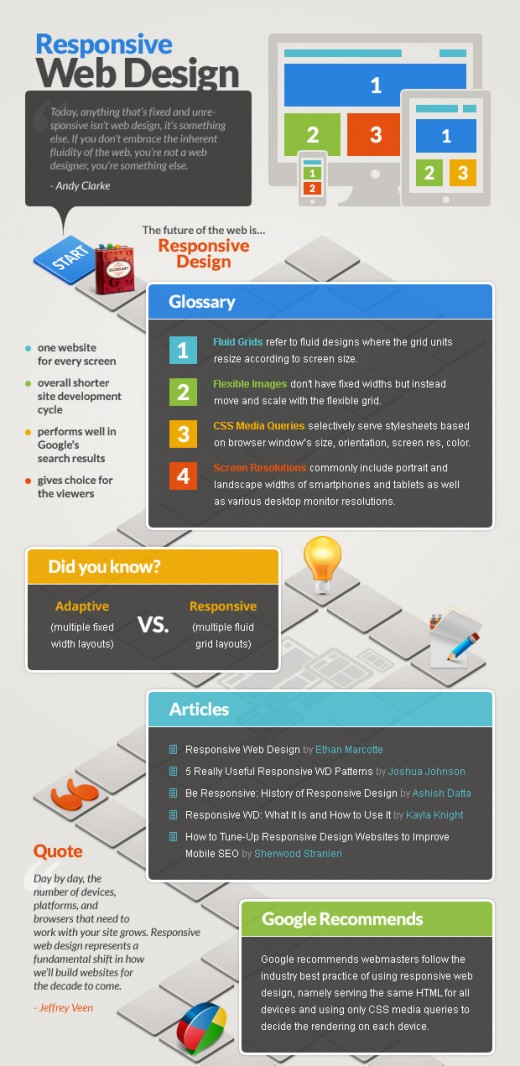
2. Responsive Web Design Infographic
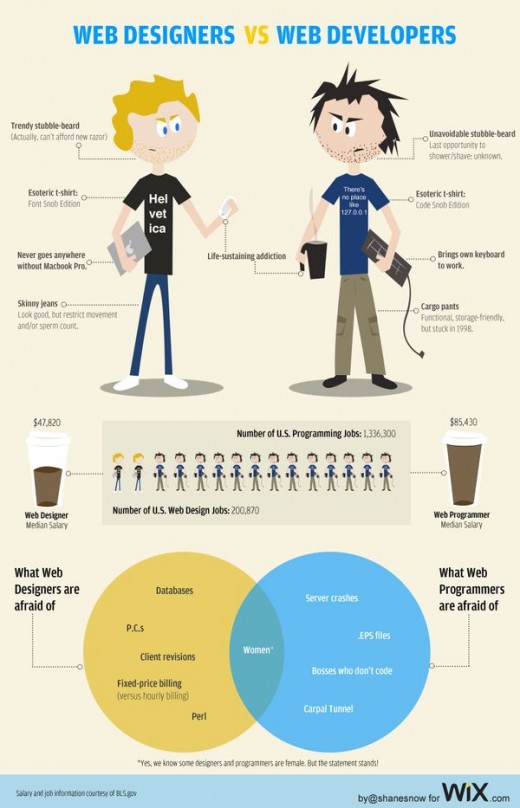
3. Web Designers vs. Web Developers
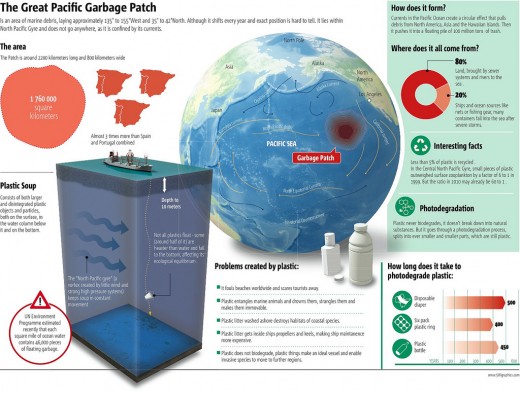
4. Great Garbage Patch
5. The Rising Cost of Higher Education

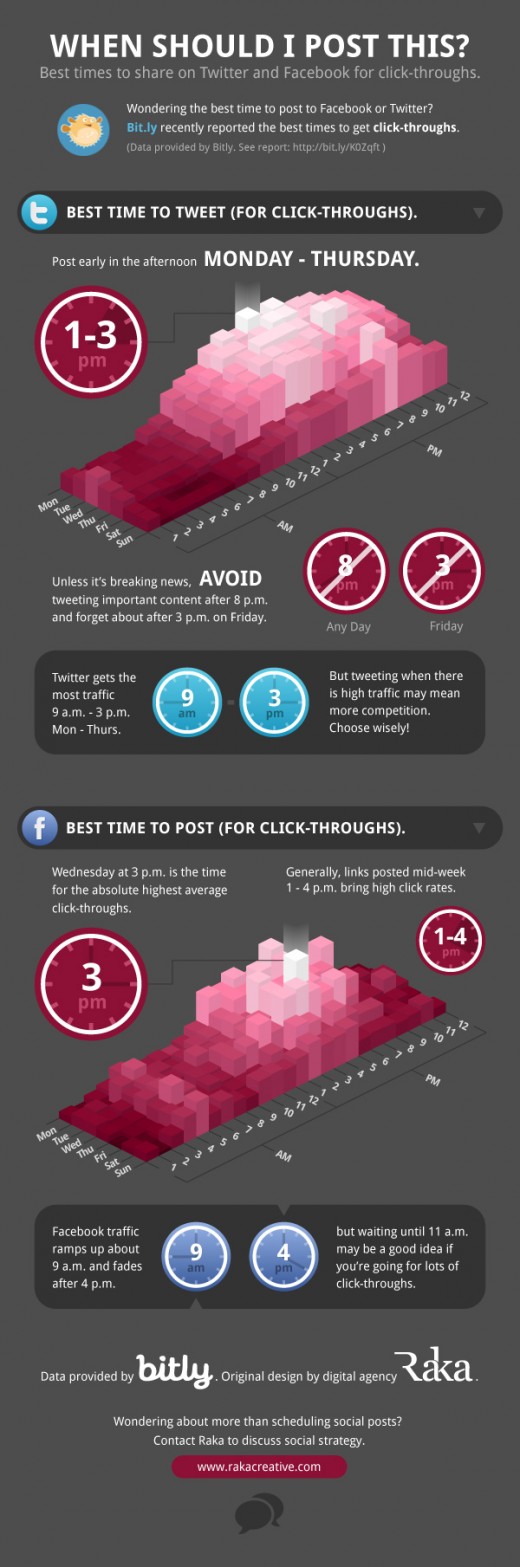
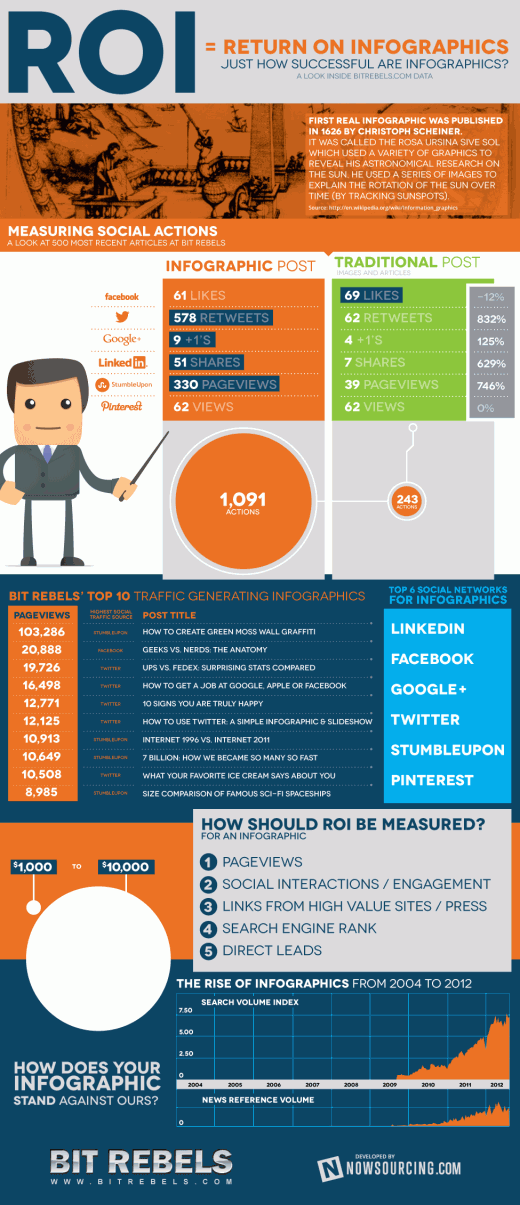
6. Social Media Analytic Infographic
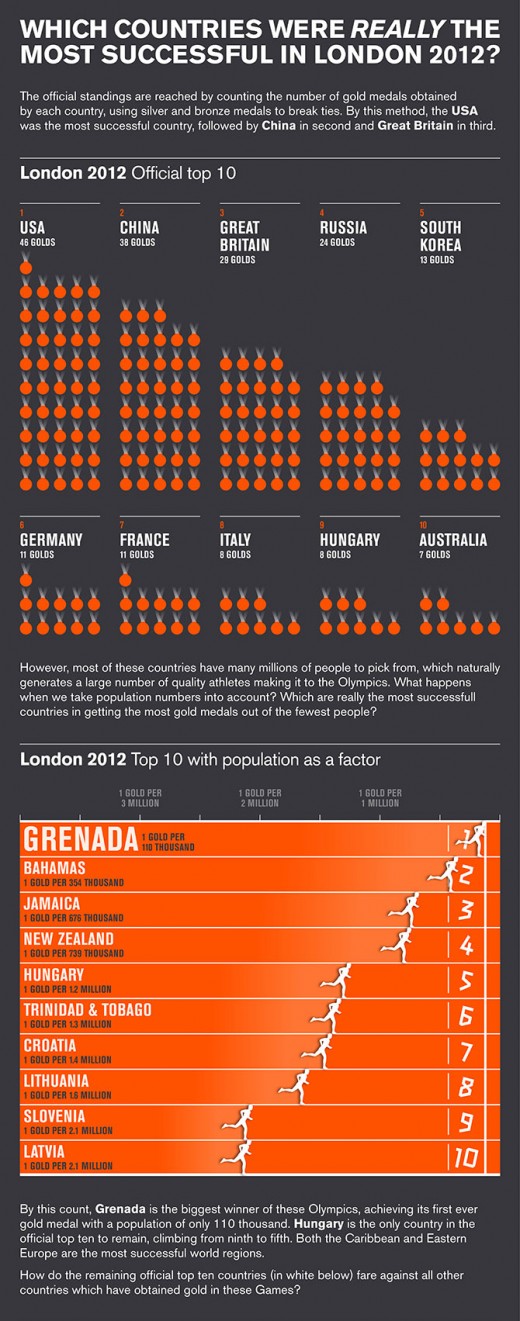
7. Which Countries were Successful at the Olympics
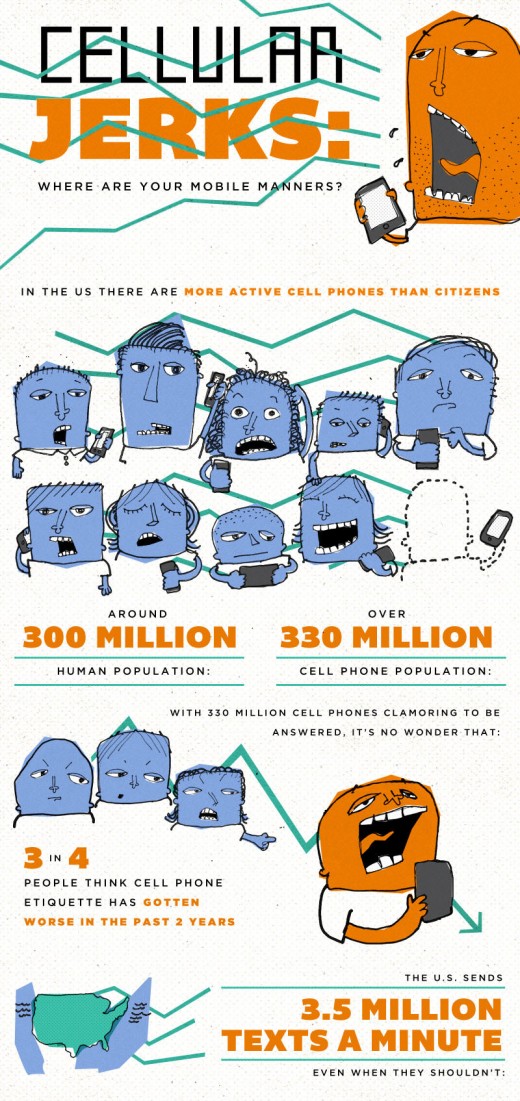
8. Cellular Jerks
9. JavaScript Framework Popularity
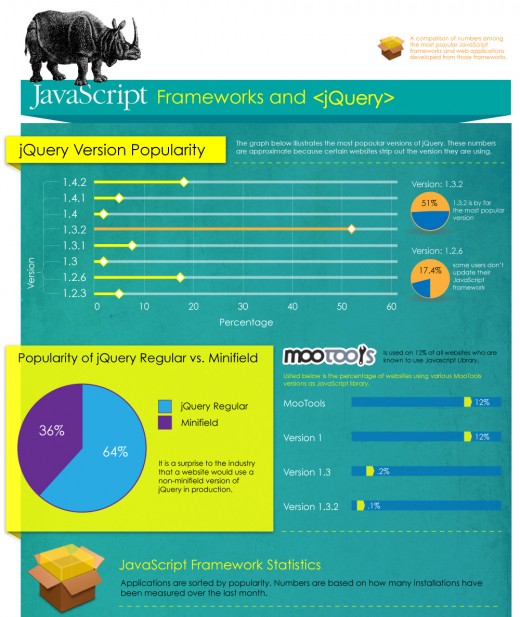
JavaScript Framework Popularity